Overview
Alluxio provides a comprehensive metrics system for monitoring the status of the Alluxio master, worker and client. Alluxio’s metrics system supports various kinds of metrics, e.g. an embedded JSON sink and the Prometheus sink. Users and developers can easily create a custom sink of Alluxio by implementing the Sink interface.
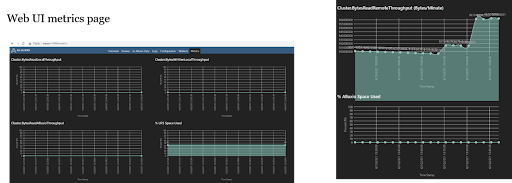
In addition, Alluxio provides a metrics page in web UI showing some key information of Alluxio, such as bytes throughput and storage space. However, if you want more flexible and universal monitoring, additional work is required.
This blog will introduce how Tencent uses Prometheus and Grafana to set up monitoring system for Alluxio in 10 minutes.
How Alluxio Metrics System Works
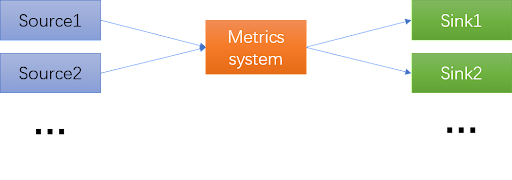
The following framework depicts Alluxio’s metrics system.
Types of Metrics
Alluxio metrics are generated by different sources and consumed by sinks. The metric system polls sources periodically and passes metric reports to sinks.
There are two types of metrics.
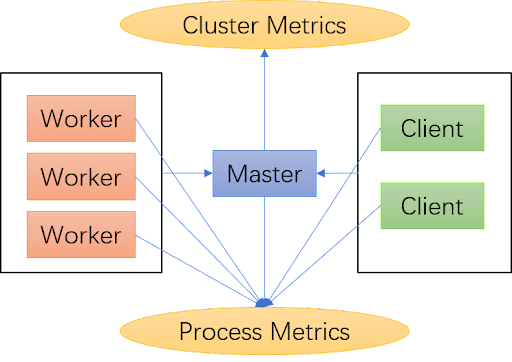
- Cluster metrics: aggregated from workers and clients, then calculated by the leading master. Cluster metrics provide snapshots of Alluxio cluster.
- Process metrics: collected by each Alluxio process, including master metrics, worker metrics, and client metrics.
Metrics Naming Patterns
In general, metrics of Alluxio follow two naming patterns. The first is for master metrics, which consist of Master, metricName and some tags (optional). For example, Master.GetFileInfoOps. The second is for non-master metrics, which consists of processType, metricName, tags, and hostnName. For example, below is openExistingFile metrics for worker. The processType is worker, the metricName is openExistingFile, followed by three tags: user, UFS location, and UFS type. The last part is the hostName of worker.

The Flow of Metrics from Worker to Master
Since the master needs to collect metrics from workers and clients to calculate the cluster metrics, the clients and workers need to report their metrics to the master. Below is a diagram of the flow of metrics from the worker to the master. Workers and clients send the metrics to Alluxio master through the heartbeat. The block on the right is the worker process, and the left is the master process. It goes from the right to the left.
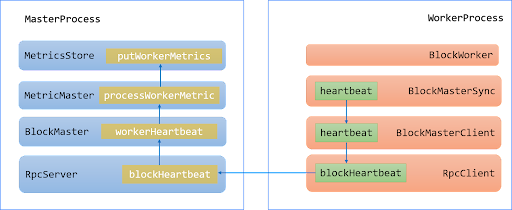
The heartbeat process is under the control of BlockMasterSync, and the metrics and other information about the worker are passed to the RpcClient, then the Rpc server receives the heartbeat and processes the metrics from workers by MetricMaster. The metrics are stored in the MetricsStore and later will be aggregated and calculated.
Client metrics are handled in a similar manner. Refer to the Alluxio source code for more details.
How to Implement a Custom Alluxio Sink
Alluxio supports many types of sinks. A sink specifies where the metrics are delivered to. For example, Alluxio has Http JSON sink, which is enabled by default, so we can view dashboards of Alluxio metrics in Alluxio web UI in the JSON format. In addition, Alluxio provides convenient and flexible sink interfaces for developers and users to implement their own sink.
Passive Sink and Active Sink
Sinks that Alluxio supports are listed below. In general, these sinks can be divided into two categories: passive sink and active sink.
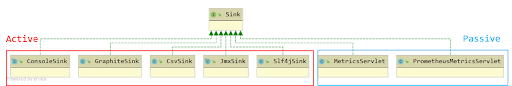
The difference between these two kinds of sinks is the way we get the metrics:
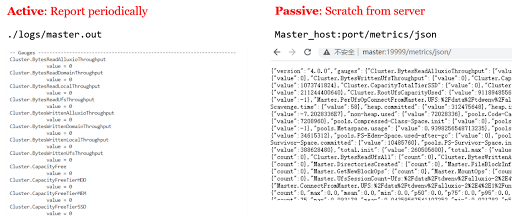
- Active: the left screenshot is the consolesink. If we enable the consolesink, the metrics will be printed into a standard output file, for example, the master.out or worker.out. The consolesink reports the metrics periodically, so you can get the metrics any time you want. From Alluxio’s perspective, it is active sink.
- Passive: the right screenshot is the HTTP JSON sink, which is the passive sink. A passive sink works as service. We can get the metrics only when we send the requests to the server. For example, if we access the metrics/json location in the Alluxio worker server, we can get the following metrics in JSON format.
How ConsoleSink and Prometheus Sink Work
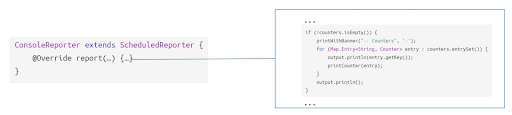
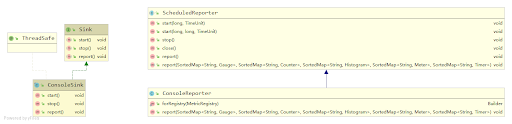
The ConsoleSink structure is shown below. We can find the ConsoleReporter in the ConsoleSink. It schedules the report that reports the metrics on a regular basis. We can see methods of the ScheduledReporter, in the report, that different types of metrics are printed in a specific format.
The Prometheus sink operates in a completely different way. There is no ScheduledReporter to report the metrics, so we need to get metrics by ourselves.
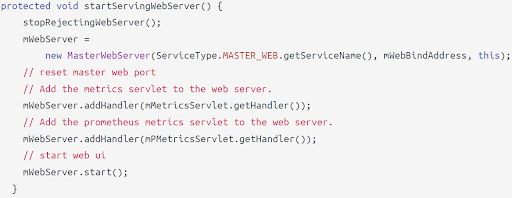
The passive sink needs to implement the getHandler method, so the master and worker process can start. For example, in the StartServingWebServer method of master process, the Prometheus handler is added to the webserver. We can access the specific location of master web server, then we can get the metrics in the format of Prometheus.
E.g. MasterProcess
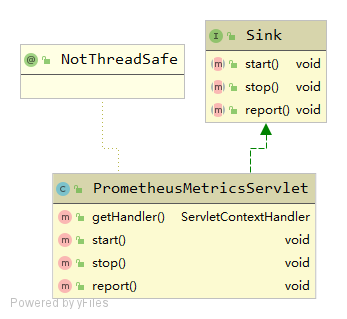
Implement the Sink
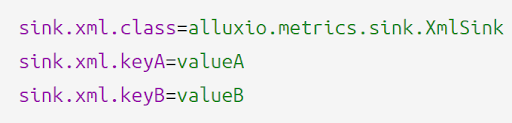
The first thing we need to do is to determine which kind of sink we want to implement, passive or active. For example, XmlSink of Alluxio prints the metrics to a specific path, so we know that it is an active sink. Just like the ConsoleSink, we need to implement the sink interface, and also construct a XmlReporter to report metrics in XML format. This gives us a custom sink. After that, we need to enable our sink by adding XmlSink class we just defined to metrics.properties. In addition, we can add some properties to our sink in this format.
conf/metrics.properties
Similarly, if you want to implement a passive sink, you can refer to the JSON sink or Prometheus sink.
How to Set Up Monitoring of Alluxio in 10 Minutes
Alluxio Web UI Monitor
On the metrics tab for Alluxio web UI, we can monitor the state of Alluxio cluster and get some key information about Alluxio. Even though the dashboard is convenient, it can sometimes be confusing (the screenshot on the right). In addition, if we want more information about Alluxio or a dashboard with more visuals, we will need another monitoring solution, which requires additional effort.

We use Prometheus sink to bridge Alluxio and Grafana since both Alluxio and Grafana have good support for Prometheus. First, Prometheus scrapes metrics from Alluxio servers and transform into time-series data and store them. Then Grafana server gets this time series data from Prometheus, after which Grafana web UI will display metrics in dashboards.
How to Set Up the Monitoring System
It only takes four steps to set up this monitoring:
- Install and start Prometheus and Grafana server. It is quite simple to follow the tutorials using the default configuration.
- Add Alluxio Jobs to Prometheus, which can find Alluxio server and scrape the metrics automatically. In the Grafana part, we provide Grafana dashboard template so we can reuse it to quickly set up the Alluxio dashboard.
- Download and import the dashboard template.
- Modify variables of the template to make it our own dashboard.
Here (16:03) is the demo video on how to import the dashboard template.
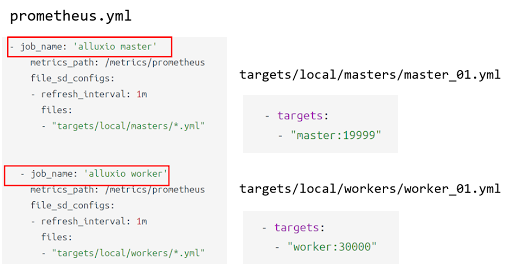
We need to add Alluxio Jobs to Prometheus first (refer to Alluxio documentation in the metrics section). Now we add two jobs in Prometheus. One is Alluxio master, and the other is Alluxio worker. Here we need to record the job_name, which is used to import Grafana dashboard.
The versions of components in the demo video are as follows:
- Prometheus Version: 2.22.2
- Grafana Version: 7.5.6
- Alluxio Version: 2.5.0-3
The following are the services set up in the demo video. There are two nodes in our cluster, worker node and master node:
- Prometheus Server @ master:9090
- Grafana Server @ worker:3000
- Alluxio Master @ master
- Alluxio Worker @ worker
As can be seen in the screenshots below, there are 8 live workers in the cluster, and the monitoring system works well, with metrics in different panels.
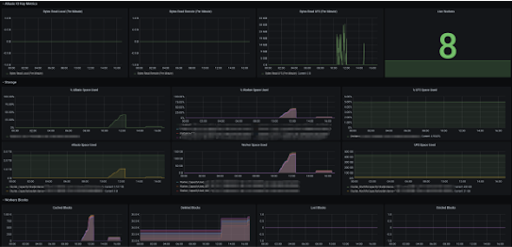
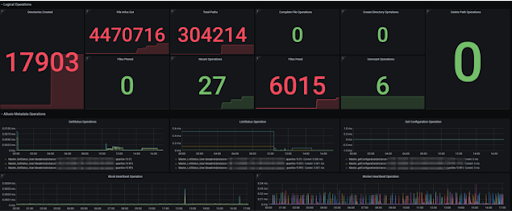
In the dashboard, we also list the labels of different rows. Adding or removing panels can be easily done on the dashboard.
- Alluxio IO Key Metrics
- Read Local & Read Remote & Alive workers …
- Storage
- Space Used & UFS Space Used …
- Workers Blocks
- Cached Blocks & Evicted Blocks …
- Logical Operations
- Mount Operations & File Pinned …
- Alluxio Metadata Operations
- Block Heartbeat Cost & Get status Cost …
- AsyncCache Blocks & Operations
- AsyncCacheSuccessedBlocks & AysncCacheFailedBlocks …
- Master JVM Memory
- Master Heap Memory & Total Memory …
Summary
By introducing Prometheus and Grafana, we have built a more flexible, agile and easy-to-use monitoring system for Alluxio.
References
About the Author
Pan Liu
- Big Data Engineer at Tencent
- Responsible for distributed computing with a focus on open source projects such as Alluxio and Presto