Get Started with the Alluxio – Presto Sandbox USING DOCKER
See how Alluxio speeds up Presto queries, even when data is remote (10 min)
The Alluxio-Presto sandbox is a Docker application that include the full analytics stack needed to run Presto queries. You’ll run queries with Presto and see the performance benefits with Alluxio, including on remote data. We’ll use the TPC-DS dataset and one of the queries for data stored in an AWS S3 bucket.
Outline
- Prerequisites
- Download and launch the container
- Explore Alluxio
- Run Queries with Presto on Alluxio
- Next Steps
Prerequisites
- Docker installed on your machine (MacOS or Linux)
- Minimum 6GB of RAM available on your local machine to run the container (8GB is recommended)
- Port
8080and port19999should be open and available.
If you have an instance of Alluxio running locally, stop it usingalluxio-stop.sh
If you have a sandbox container running, stop it usingdocker rm -f alluxio-presto-sandbox
- Port
If you’re running Docker on Mac, this what you’ll need:
Increase the default Docker VM settings if you’re running Docker on MacOS.
- Go to
Docker > Preferences > Advanced > Memoryand increase the slider to a minimum of6GiB. It is recommended to give anywhere between6.5GiB-8GiB - It is recommended to give 4 or more CPUs to the VM
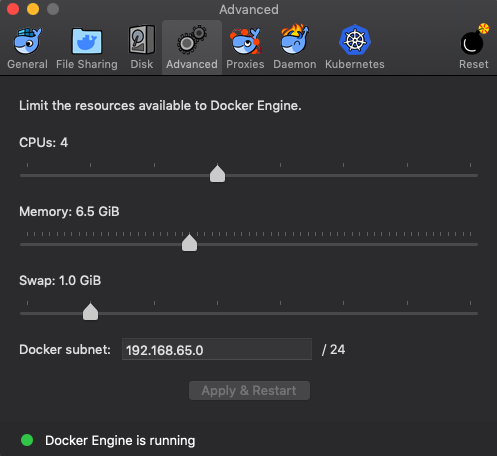
Press Apply & Restart at the bottom of the dialog.
DOWNLOAD AND LAUNCH THE CONTAINER
Explore Alluxio
We’ll use a combination of the Alluxio web UI at http://localhost:19999 and the Alluxio CLI to explore the Alluxio filesystem and cluster status
The container comes with an Amazon S3 bucket pre-mounted in Alluxio at the /scale1 directory. It contains data for TPC-DS benchmarks at the “scale 1” size factor which amounts to about 1GB of data across multiple tables.
Open the Alluxio web UI at http://localhost:19999 to check if the Alluxio master has started successfully. If not, wait a few moments, refresh the page, and it should become available.
Run alluxio fs mount from within the container to see the Alluxio mounts
alluxio fs mount
s3://alluxio-public-http-ufs/tpcds/scale1-parquet  on  /scale1  (s3, capacity=-1B, used=-1B, read-only, not shared, properties={aws.secretKey=******, aws.accessKeyId=******})
/opt/alluxio/underFSStorage                        on  /        (local, capacity=58.42GB, used=-1B(0%), not read-only, not shared, properties={})
Next, we’ll investigate more about how to interact with Alluxio and load data into the cache.
alluxio fs ls /scale1
drwx------                                              3       PERSISTED 07-05-2019 19:41:42:054  DIR /scale1/call_center
drwx------                                              3       PERSISTED 07-05-2019 19:41:42:100  DIR /scale1/catalog_page
drwx------                                           2067       PERSISTED 07-05-2019 19:41:52:535  DIR /scale1/catalog_returns
drwx------                                           1832       PERSISTED 07-05-2019 19:41:59:149  DIR /scale1/catalog_sales
drwx------                                              3       PERSISTED 07-05-2019 19:41:59:152  DIR /scale1/customer
drwx------                                              3       PERSISTED 07-05-2019 19:41:59:156  DIR /scale1/customer_address
drwx------                                              3       PERSISTED 07-05-2019 19:41:59:161  DIR /scale1/customer_demographics
drwx------                                              3       PERSISTED 07-05-2019 19:41:59:165  DIR /scale1/date_dim
drwx------                                              3       PERSISTED 07-05-2019 19:41:59:169  DIR /scale1/household_demographics
drwx------                                              3       PERSISTED 07-05-2019 19:41:59:173  DIR /scale1/income_band
drwx------                                            262       PERSISTED 07-05-2019 19:42:00:104  DIR /scale1/inventory
...
The /scale1 directory contains some more directories which are named after common tables used in TPC-DS benchmarking.
Take a look at the cluster usage summary by using the web UI at http://localhost:19999 or by running alluxio fsadmin report
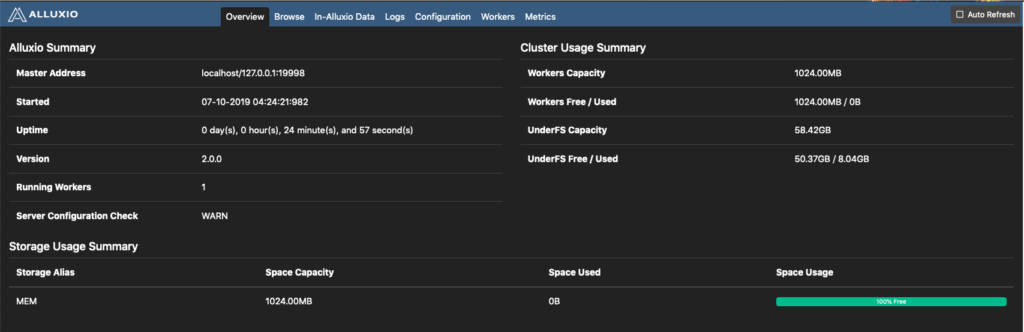
Take note of the Workers Capacity and the Workers Free / Used fields. These describe the state the Alluxio worker’s cache storage.
Load data into memory from one of the tables using alluxio fs load, and afterwards there will be a change in the amount of free and used capacity in the web UI and when running alluxio fsadmin report
alluxio fs load /scale1/customer_demographics
/scale1/customer_demographics/part-00000-68449736-ad44-43d2-841f-4d55afd9e0b3-c000.snappy.parquet loaded
/scale1/customer_demographics/part-00000-267c2412-d427-4907-a398-e6de535ff1d4-c000.snappy.parquet loaded
/scale1/customer_demographics/_SUCCESS already in Alluxio fully
/scale1/customer_demographics loaded
This command will download remote data. Depending on the network bandwidth, it may take a few seconds or more to finish, so you can use this time to eat some of that snack you grabbed earlier.
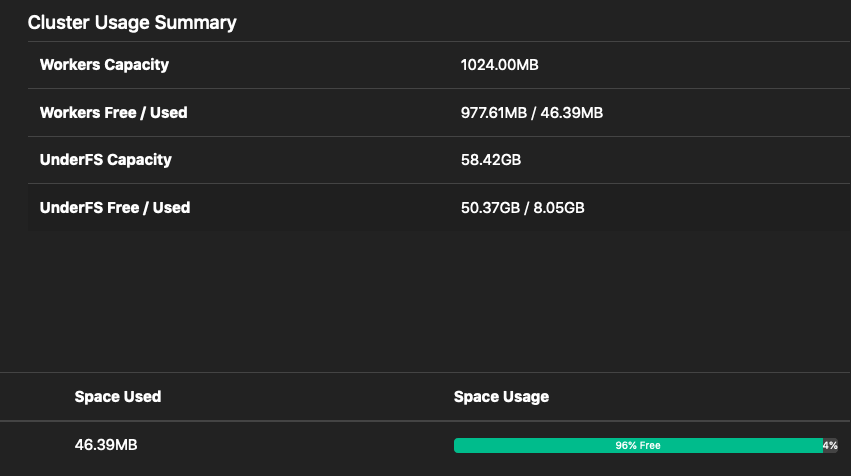
Refresh the Alluxio Web UI. The Workers Free / Used row will have been updated to reflect to newly cached data in the Alluxio worker.
You can now see that the Free Capacity has decreased from 1024.00MB from earlier, and the used capacity in the MEM tier has increased to 7.40MB.
RUN QUERIES WITH PRESTO ON ALLUXIO
Now we’ll use Presto + Alluxio to show how Alluxio can massively decrease query times by reading cached data. You’ll use Presto through the command line; however, you can also use the Presto UI at http://localhost:8080 to view the status of your queries. Note that the last step – Rerunning the Query – will show you the performance results.
presto --catalog hive --debug
presto>
Tip: You can exit at any time by typing exit;
The container comes pre-loaded with tables in Presto. A schema named alluxio has already been defined. The database contains the tables from the TPC-DS benchmark.
show schemas;
	       Schema
--------------------
  alluxio
  default
  information_schema
  (3 rows)
Use the alluxio schema
use alluxio;

USE
presto:alluxio>
Once you see the prompt presto:alluxio> you will be using the schema. The table definitions can be found in /usr/share/tpcdsData/createAlluxioTpcdsTables.sql.
We’re going to run the ss-max query from the TPC-DS benchmark which can be found at /usr/share/tpcdsData/ss_max.sqlwithin the container.
This query is run against the store_sales table which represents a snapshot of a retail store’s sales information at a specific point in time. The columns in this table are very similar to what a store may collect from its point-of-sale systems.
The query performs the following actions on the store_sales table:
- gets the total number of rows in the table with
count(*) - gets the total number of rows in the table with non null transaction date with
count(ss_sold_date_sk) - gets the number of unique sales with
count(distinct ss_sold_date_sk) - gets the highest value of each column in the table. This includes fields such as the transaction date, the transaction time, the item, customer, address, etc.
Overall, it provides a short summary of the table’s information

The query might take some time to run, you can use this period to eat some more of that snack
select
  count(*) as total,
  count(ss_sold_date_sk) as not_null_total,
  count(distinct ss_sold_date_sk) as unique_days,
  max(ss_sold_date_sk) as max_ss_sold_date_sk,
  max(ss_sold_time_sk) as max_ss_sold_time_sk,
  max(ss_item_sk) as max_ss_item_sk,
  max(ss_customer_sk) as max_ss_customer_sk,
  max(ss_cdemo_sk) as max_ss_cdemo_sk,
  max(ss_hdemo_sk) as max_ss_hdemo_sk,
  max(ss_addr_sk) as max_ss_addr_sk,
  max(ss_store_sk) as max_ss_store_sk,
  max(ss_promo_sk) as max_ss_promo_sk
from store_sales
;
When the query finishes, you can press q to leave the query results summary. The output should look similar in your terminal.
  total  | not_null_total | unique_days | max_ss_sold_date_sk | max_ss_sold_time_sk | max_ss_item_sk | max_ss_customer_sk | max_ss_cdemo_sk | max
	---------+----------------+-------------+---------------------+---------------------+----------------+--------------------+-----------------+----
 2879789 |        2750838 |        1823 |             2452642 |               75599 |          18000 |             100000 |         1920793 |
  (1 row)

Query 20190710_051550_00010_7pbtm, FINISHED, 1 node
http://localhost:8080/ui/query.html?20190710_051550_00010_7pbtm
Splits: 58 total, 58 done (100.00%)
CPU Time: 2.8s total, 1.03M rows/s, 6.12MB/s, 17% active
Per Node: 0.2 parallelism,  210K rows/s, 1.25MB/s
Parallelism: 0.2
Peak Memory: 5.71MB
0:14 [2.88M rows, 17.2MB] [210K rows/s, 1.25MB/s]
Note: here that in the last line of the output, 0:14 represents the query time in mm:ss format.
Because this is the first time we’re reading the data, it is pulled from S3 and is then returned through Alluxio. At the same time, the Alluxio worker will be caching the data in memory so that the next time the data is accessed it can be read at memory speed.
If you refresh the Web UI again, you should see that the Alluxio worker usage has increased.
Because the first query had to read all of the data from the store_sales table through Alluxio the data is now cached locally. Running the ss-max query again should be faster.
Good luck trying to finish your snack before the query finishes!
Let’s run the query again
select
  count(*) as total,
  count(ss_sold_date_sk) as not_null_total,
  count(distinct ss_sold_date_sk) as unique_days,
  max(ss_sold_date_sk) as max_ss_sold_date_sk,
  max(ss_sold_time_sk) as max_ss_sold_time_sk,
  max(ss_item_sk) as max_ss_item_sk,
  max(ss_customer_sk) as max_ss_customer_sk,
  max(ss_cdemo_sk) as max_ss_cdemo_sk,
  max(ss_hdemo_sk) as max_ss_hdemo_sk,
  max(ss_addr_sk) as max_ss_addr_sk,
  max(ss_store_sk) as max_ss_store_sk,
  max(ss_promo_sk) as max_ss_promo_sk
from store_sales
...

Query 20190710_051959_00011_7pbtm, FINISHED, 1 node
http://localhost:8080/ui/query.html?20190710_051959_00011_7pbtm
Splits: 58 total, 58 done (100.00%)
CPU Time: 2.9s total,  998K rows/s, 5.95MB/s, 52% active
Per Node: 0.6 parallelism,  597K rows/s, 3.56MB/s
Parallelism: 0.6
Peak Memory: 5.71MB
?:?? [2.88M rows, 17.2MB] [597K rows/s, 3.56MB/s]
Tip: exit the Presto shell with exit;
Take note of the execution time of the query. Did you see a change in performance?
If you want replicate the same result, you will need to free the data from Alluxio memory. After exiting the Presto shell, run the alluxio free command to free the data.
alluxio fs free /scale1
You can exit the docker terminal by typing exit at the prompt. Then, shut down and delete the container by running docker rm -f alluxio-presto-sandbox.